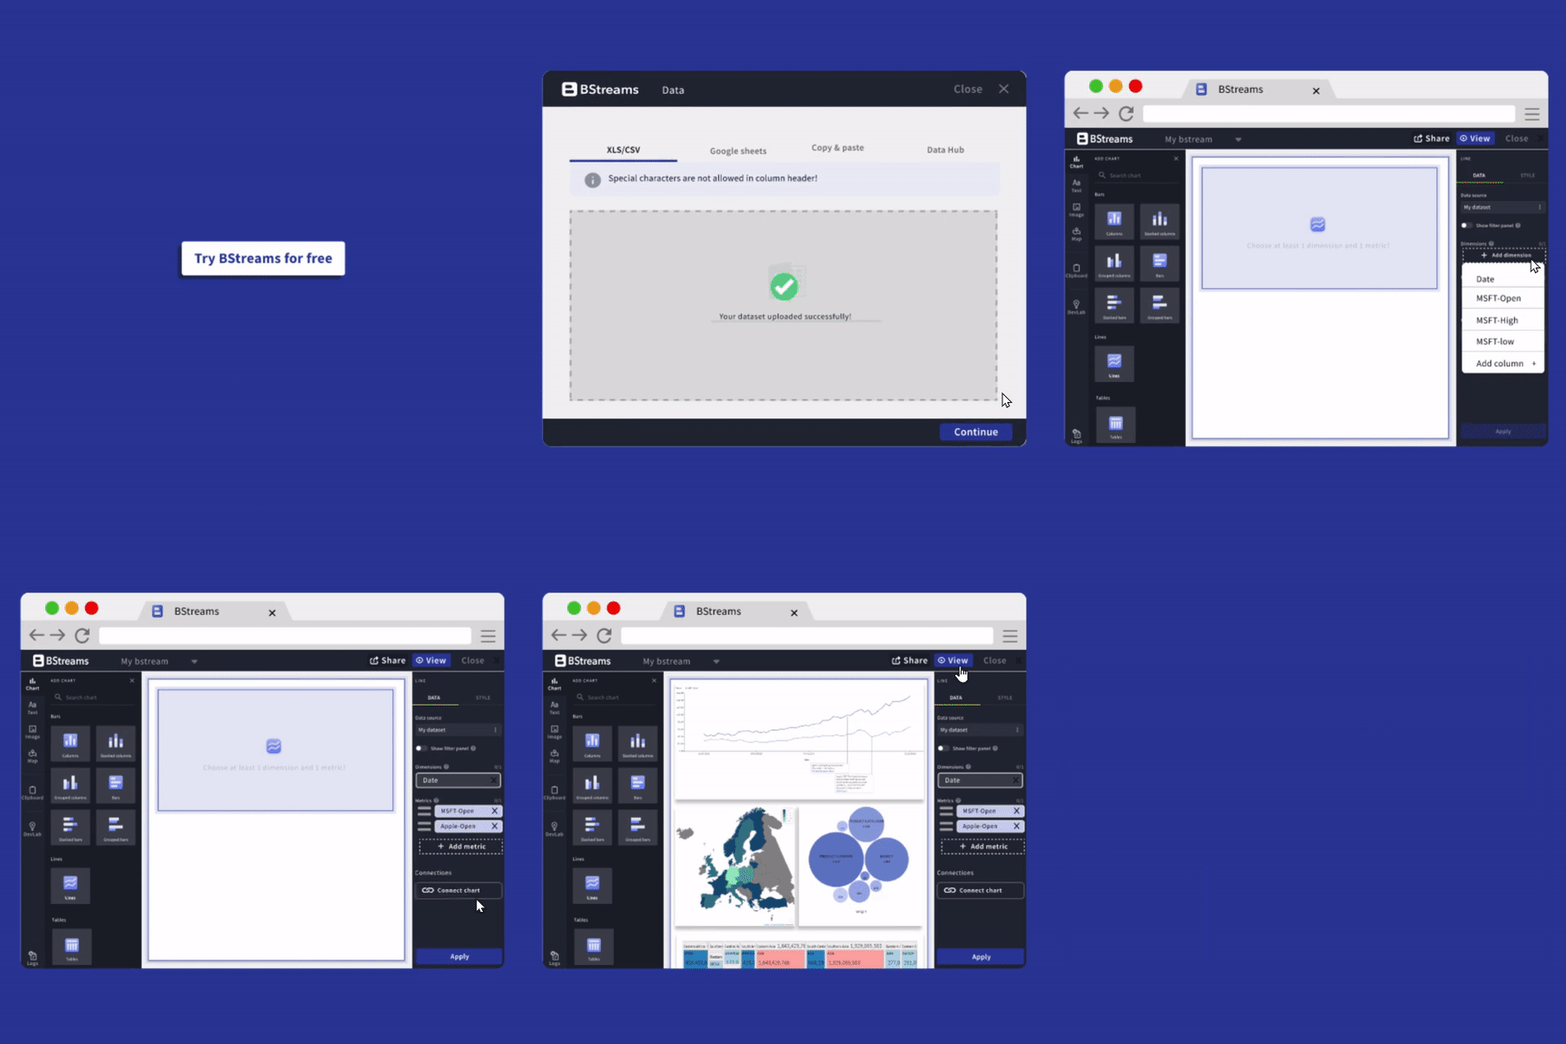
Combine data, texts and images, add filters to provide insights. Bstreams is an intuitive data visualisation tool that empower people and teams to easily create amazing interactive BI dashboards and reports in a collaborative way

How to create compelling reports and dashboards in a few clicks
We developed BStreams with people and teams in mind who need to unlock the hidden potential in all the data they have collated
Data preparation and management
Upload once for unlimited data visualisation! Each user can independently prepare the data which remains available and can be used in many ways. No work from the IT department required.
Bring data visualisation to life
It’s just a Drag and Drop job… Changing views, chart types, formats or table sizes is effortless as well as adding filters and other analysis parameters. BStreams is built to avoid beginner mistakes.
Share and update
Embed reports and BI dashboards on your website automatically or share them with colleagues and stakeholders using a simple link. Outcomes are updated in real time by simply changing the data when needed.
See everything you can do with your data in a simple and intuitive way
Use Bstreams to create client presentations, research reports, data-rich sales pitches, interactive infographics and more. Easily share and publish your contents!

Create unforgettable reports
Use BStreams to easily communicate complex messages in a visually engaging way. Share KPIs and goals, extract valuable insights from data, invite to action!

Create data stories in the easiest way
Thanks to Bstreams you can quickly create immersive data driven storytelling rich with charts, maps, tables, notes and images, regardless of your background

Boost Data Visualisations
Use fully responsive charts and infographics, which look great on screens of any size. Easily show trends and insights. No coding or design skills required

Get BI data analysis on your site
Provide understandable information about company trends and performance, find answers to hard questions creating real time BI dashboards!
Get the Ready Data Visualisation tool made for teams
Bstreams is designed for collaboration. Create data-driven content faster and make your team more efficient. Invite team members to edit projects with ease. Keep your data organised under one roof

For company’s employees
With BStreams anyone can create interactive data reports! Invite teammates to edit projects and share data sources if you want. Solve all business reporting needs

The way to save Agency time
Thanks to BStreams you can create different BI dashboards for each client. Data graphs, charts and maps are the quicker and most effective way to get the insights you’re after

Nonprofit storytelling
Using Bstreams you can easily combine informative graphs and metrics giving everybody a beautiful and clear overview of all your activities over time. No need to code

Memorable Research
Just drag and drop Bstreams elements to create a wide variety of customisable reports with the help of peers; after that, it only takes a few clicks to integrate them into your research. Super easy!

Ideal tool for sales
Thanks to Bstreams you can create great operational dashboards and reports to show only the specific information each team member really needs to manage sales successfully
Create and share dashboards, reports and data stories in minutes, not days
Whatever your field of work, Bstreams helps you get the best out of your data by creating customised BI dashboards and reports
- Visualise data from spreadsheets in a professional way
- Highlight actionable insights and trends for your stakeholders
- Real time data refresh, no coding skills required
- Share via link, on web or social network


