Easily create a large variety of customisable reports, integrate them in your research, invite team members to collaborate on either data preparation and visualisation or just one of the tasks

How long does your team spend preparing data and creating charts, maps and tables?

- You want to insert visual elements in your research to tell the data but you don’t have specific skills.
- Each team member needs to use data differently so you always end up using overly complex spreadsheets where important information gets easily lost.
- Your colleagues and collaborators need to create reports and dashboards collaboratively but it takes a thousand steps.
Speed up and simplify all kinds of visual data representation with flexible tools that anyone in your team can easily use. Create and update reports in real time, share them online with internal and external stakeholders.
Unify all your data under one roof, deliver insights with no coding.
Communicate your research results in a stunning manner!
Visualise the full potential of the data, tell your results in a way more appealing to the human brain!
- Bring all your data together in one hub and let everyone use it, or make the information available for others to view but not edit.
- Show valuable information in a clean and clear way with interactive visual elements, customise results in just a few clicks.
- Modify dashboards, reports and data stories in a collaborative way at the same time. The easiest way to multi-hand work on reports!
An image is worth a thousand words and this is even more true in any research field. If you communicate data visually, you can make it easier to understand and remember. Thanks to Bstreams, everyone can do it. Create graphs, maps and tables that are beautiful to look at and are effective too!

How to create compelling reports and dashboards
We developed BStreams keeping in mind Research Groups that need to produce different types of graphs, maps and charts using reports and dashboards to communicate results. You can add filters, notes and highlight crucial information. Upload the data to the hub that can be shared with everybody or made available in secure mode. All data will always be organised!
Data preparation and management
Upload once for unlimited data visualisation! Each user can independently prepare the data which remains available and can be used in many ways. No work from the IT department is required.
Bring data visualisation to life
It’s just a Drag and Drop job… Changing views, chart types, formats or table sizes is effortless as well as adding filters and other analysis parameters. BStreams is built to avoid beginner mistakes too!
Share and update
Embed reports and BI dashboards on your website automatically or share them with colleagues and stakeholders using a simple link. Outcomes are updated in real time by simply changing the data.
BStreams Platform Features for Research
Easily create effective data visualisations using beautiful interactive maps, charts and tables. Share them both internally and externally

Collaborate in making a report, easily share results
Allow multi-handed reporting. Create insightful narratives and share them by link, on a client’s social network or website.

Integrate and enrich data
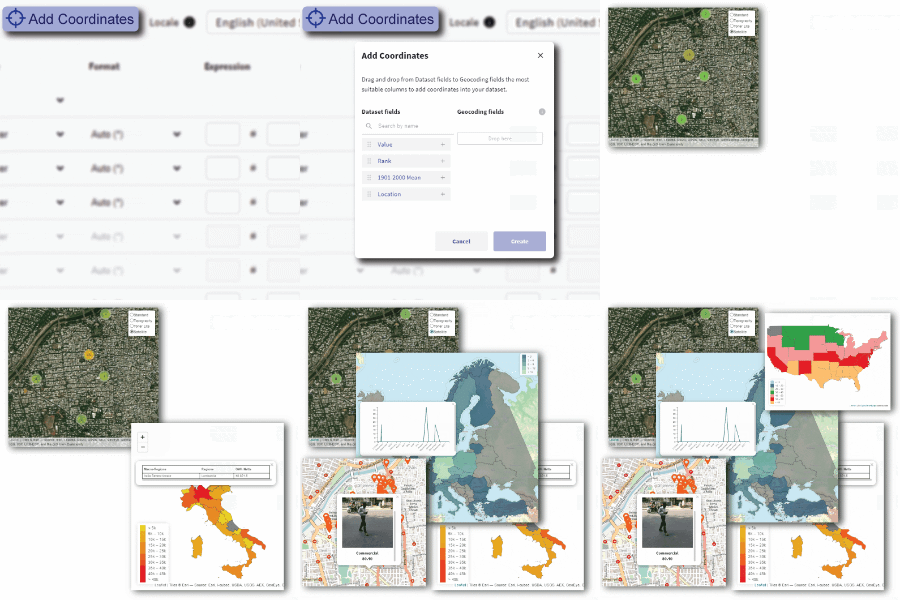
Unify all data in one place. Enrich the datasets as needed, creating new calculation fields, inserting geographic coordinates, setting filters and analysis parameters.

No IT dependency
Create data streams by connecting multiple data sources, tables and files, without any assistance from your IT department.

Proof of error interface and tools
Get reports and dashboards that are easy to understand at a glance and beautiful to look at. No specific skills required.
Want to know more?
Enterprise ready collaborative Business Reporting Platform
Solve your business reporting needs regardless of either the source of the data or the skills of your employees. Everybody can create interactive data reports in a collaborative way!
Custom reporting collaborative tool made for Agencies
Reports are vital for your business, putting all your activities together in one place. Create customised reports in an easy and collaborative way, save your Agency time!
Custom reporting collaborative tool made for Nonprofit
Quickly and easily create a large variety of customisable reports and dashboards, add filters for better insights, share results on your website, social networks or via link
KPIs reporting collaborative tool made for Sales Managers
Key Performance Indicators can really help your sales team measure their efficiency. Tell your KPIs in an easy and collaborative way, so you can improve methods and processes to drive sales!
Take a look: here’s what your Research Group can do thanks to BStreams
Create and share beautiful data visualisations and data stories in minutes, not days
BStreams helps you get the best out of your data by creating custom made visualisations and data stories to better tell your results
- Upload data for multi-hand use, organise it under one roof
- Customise language, charts, tables, maps and layout to match your needs
- Highlight useful insights and trends for any stakeholder
- Real time data refresh, easy publishing and sharing options


