Ready collaborative Reporting Platform for your business
Solve all your business reporting needs. Thanks to BStreams everybody can create interactive data reports in a collaborative way!
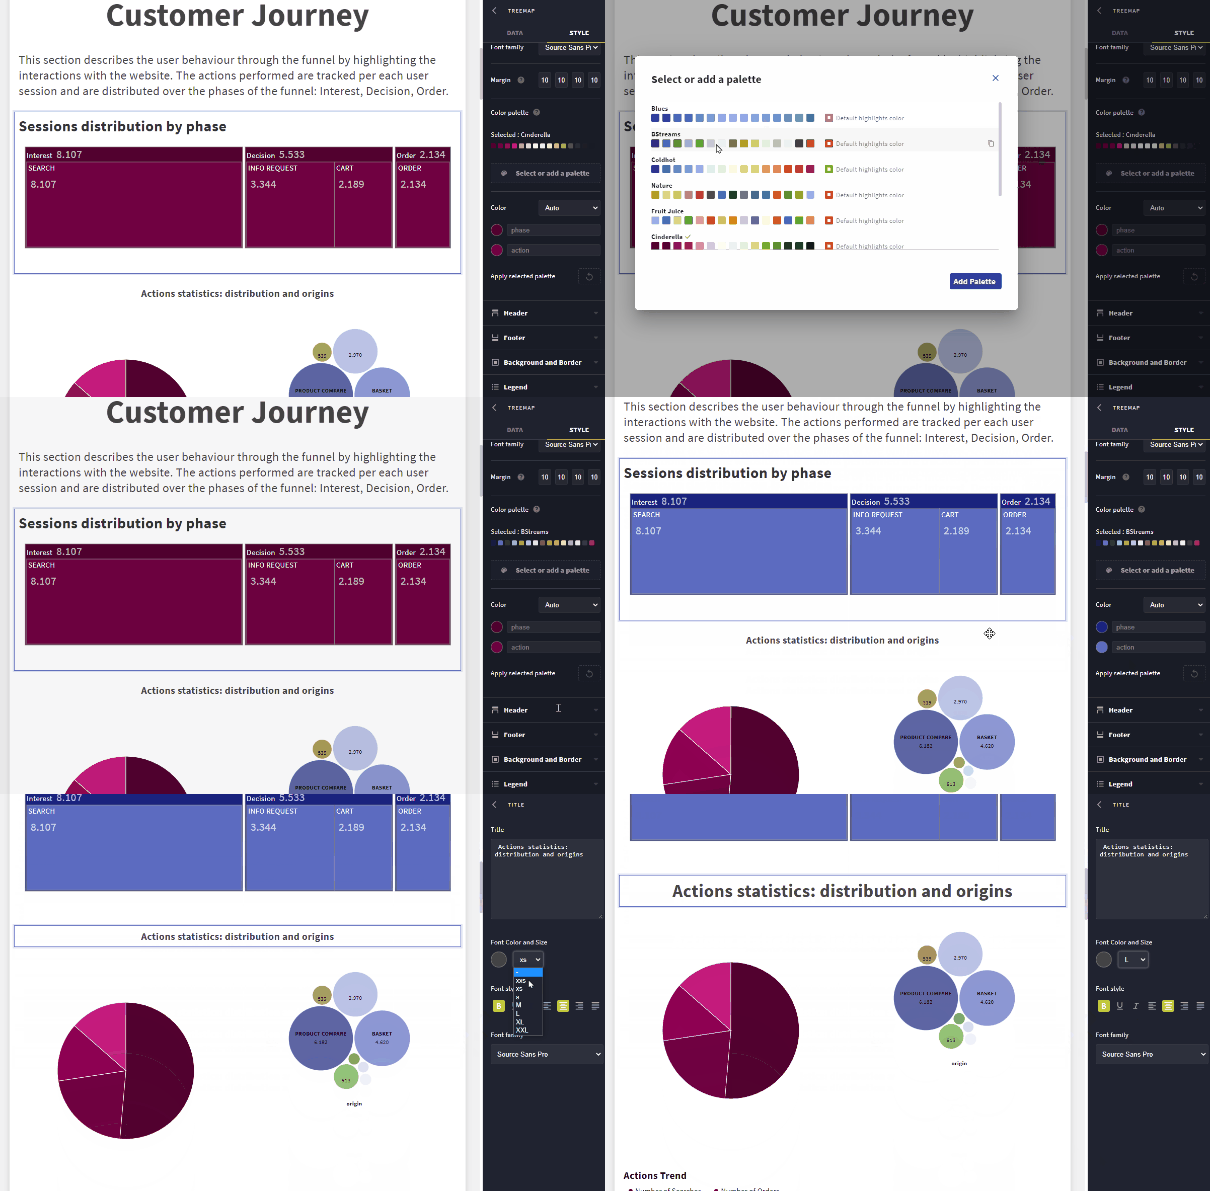
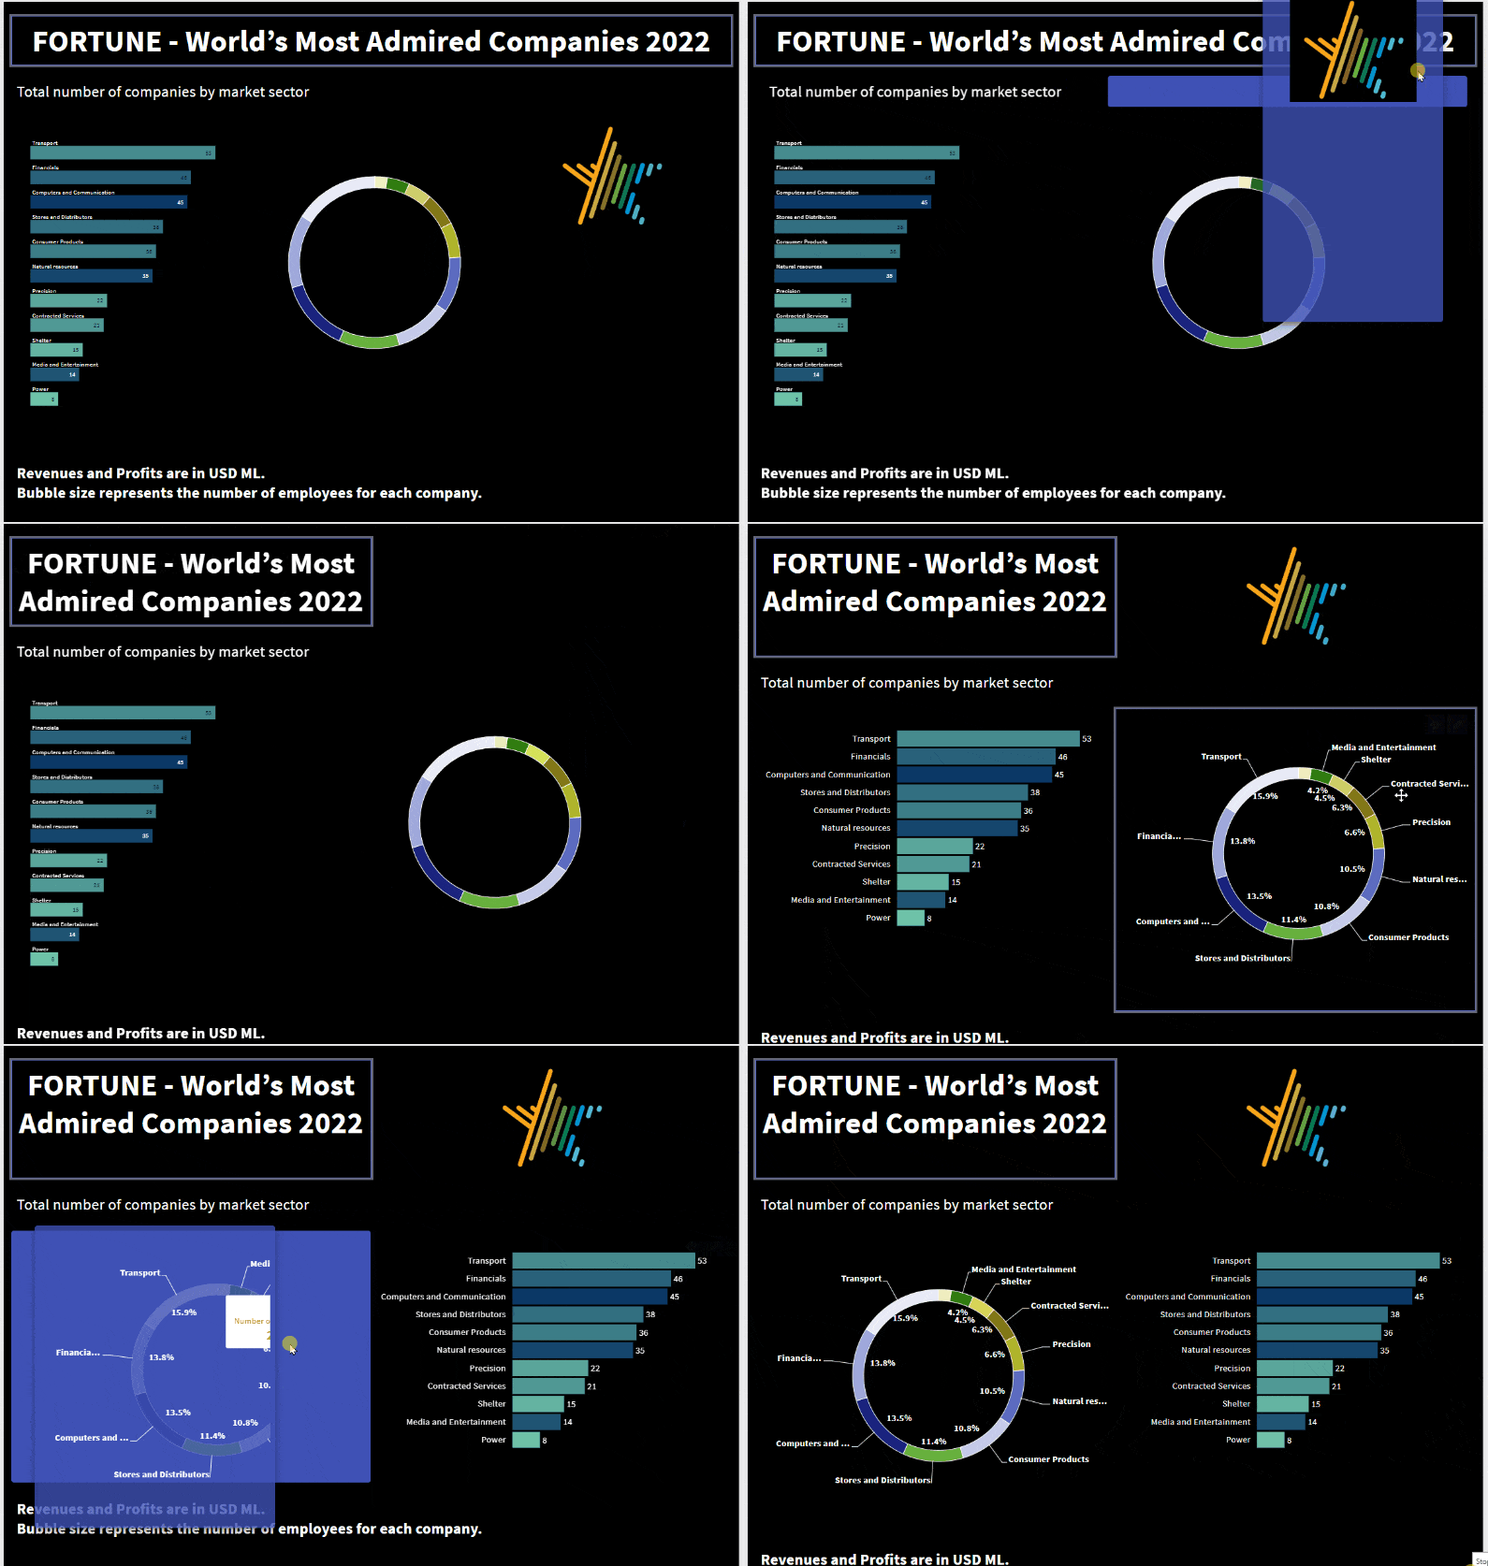
Upload data for multi-hand use, choose the size of charts and maps, how much space to leave between the elements, which colours to use and more: just in a few clicks.
Custom reporting collaborative tool for your Agencies
Save time when reporting and during alignment meetings. Graphical visualisation of the data is worth a thousand words!
Create highly customisable interactive data reports with an easy tool for multi-hand use. Effectively communicate the goals achieved to all your clients and build customer loyalty.


Easily create a large variety of reports for Nonprofit
Speed up and simplify all kinds of reporting with flexible dashboards that anyone in your Nonprofit organisation can easily create.
Update in real time and share online with internal and external stakeholders. Unify all your data and deliver insights with no coding.
Communicate your research results in a stunning manner!
Bring all your data together in the hub and let everyone use it, or make the information available for others to view but not edit.
Show valuable information in a clean and clear way with interactive charts, maps and tables; it’s just a drag and drop job… Speed up and simplify all kinds of visual data representation!


Tell your KPIs effectively, promote action to drive sales
Combine informative graphs and actionable metrics giving your teammates a quick and clear overview of sales performance.
Guide your team to the next best action based on your sales data and process. No work from the IT department required. Get the freedom to represent data independently!
Create and share dashboards, reports and data stories in minutes, not days
Whatever your field of work is, Bstreams helps you get the best out of your data by creating customised BI dashboards and reports
- Get the easiest tools to multi-hand work on reports
- Customise language, charts, tables, maps and layout to match your needs
- Highlight actionable insights and trends for your team members
- Real time data refresh, easy sharing options


